- Home
- Our work
- Indicators, measurement and reporting
- Patient safety culture
- Stage 3: Analysis and reporting
Stage 3: Analysis and reporting
Advice on using the data collected through surveys of patient safety culture.
This section steps through the process of analysis and reporting survey data on patient safety culture. The examples used here relate to the Australian Hospital Survey on Patient Safety Culture 2.0 (A-HSOPS 2.0), however this information can be used to support the implementation of any survey of hospital staff. This section should be read alongside the A-HSOPS 2.0 technical specification.
Plan the analysis
Considerations when developing the plan
There are a broad range of ways to use the data collected through the A-HSOPS 2.0. An analysis plan will help ensure that the analysis is efficient and meets the project’s requirements. Considerations include:
- Timely feedback is critical: Keep the initial analysis manageable so feedback can be provided in a timely way – this will keep staff and leadership engaged in the process
- Stage the analysis: It is not necessary to undertake all of the analysis at once. Initial findings can be used to begin the consultation process and seek input on additional analysis requirements (example provided below)
- Customised reports: Key stakeholders include the board, quality committees, management and staff. Customise your reports for each of these audiences, from one- or two-page executive summaries to more complete reports that use statistics to draw conclusions or make comparisons
- Resources: Analysis of the data takes time and requires expertise. It may be necessary to engage an external vendor to help with this component of the work. It is best to engage an external vendor early in the project
- Minimum numbers: To protect confidentiality of respondents ensure that there are at least five respondents for any group that is reported on.
Options for analysis
Data can be analysed at a hospital, department or unit level and a range of statistics can be generated. More detailed analysis can explore the data by the demographics collected in the survey.
| Scoring methods | Level of measurement | Demographics |
|---|---|---|
|
|
|
Staff who work at the hospital for a short period of time may have a different perception of the culture. The project team may consider analysing the following groups separately based on the objectives of the project:
- Staff who have not been at the hospital/unit very long (eg less than 6 months)
- Locums
- Students/ trainees and registrars.
Recommended staging of the analysis
| Stage 1 | Hospital level analysis: This will provide an overall view of the hospital’s culture and can be quickly disseminated to stakeholders. If resources allow, include a high level summary of the key themes identified in the comments. |
|---|---|
| Stage 2 | Analysis for each unit/department: Culture varies within hospitals. Providing data at a unit/department level is critical to understanding the specific culture of that area and engaging staff in the findings. Results should only be reported where at least five staff have completed the survey; results may need to be aggregated up to a higher level for small hospitals. |
| Stage 3 |
More detailed analysis includes:
|
Create, clean and code
Create the file
Each row in the data file should represent the responses of one staff member and each column should represent a different survey item. The original data should be stored as a .csv file as this format can be imported and exported from most programs.
The A-HSOPS 2.0 technical specification sets out the data labels that should be used for each of the items in the survey. Storing the data in-line with the technical specification will ensure that future staff can easily understand the contents of the data file and supports comparison overtime within, or between, services.
Data collected through an online platform can be exported into a data management program, such as Excel or SPSS. Any paper-based surveys will need to be entered manually. The responses should be entered carefully into the correct column and spot checks should be performed by another team member to ensure accuracy. Questions requiring written responses (i.e., ‘Section G: Other, please specify’; ‘Section H: Your comments’) should be entered verbatim (as written by the respondent).
Add hospital level data
The A-HSOPS 2.0 technical specification provides advice on what information on the administration of the survey should be included in the data file. These data include the timing of the data collection, number of staff at the hospital and sampling method.
Data management
Several data files will be created during the analysis process. It is important to maintain the original data file created when the survey responses were entered. Additional files should be carefully labelled for version control. Retaining the original file allows you to:
- Correct possible errors made during data cleaning or recoding processes
- Go back and determine what changes were made to the data set and conduct other analyses.
Ensure that all the data files are stored securely on a protected drive. The data files should only be accessible to members of the project team who undertake the analysis.
Code the data
All survey response options are assigned a numeric value, including ‘does not apply’ and don’t know’. Most responses will be coded from 1 to 5 (or 9 for Does not apply/Don’t know). For demographic and background questions, codes have been assigned for each of the response options. These are detailed in the A-HSOPS 2.0 technical specification.
The A-HSOPS 2.0 includes some negatively worded items. Negative items are simply items where the response scale differs in direction from most other items. In this survey, negatively worded items are the ones where a favourable responses is ‘Strongly disagree’ and ‘Disagree’ or ‘Never’ and ‘Rarely' (e.g., ‘In this unit, staff feel like their mistakes are held against them'). Negatively worded items need to be recoded prior to analysis. The A-HSOPS 2.0 technical specification provides information on which items are negatively worded and coding of these items.
Check and clean the data
It is important to check to see if the data contains errors. If you are using a statistical analysis program, such as SPSS, start by producing frequencies of responses for each item looking for out-of-range values or values that are not valid responses. If using Excel, you can apply a filter and check each question for out-of-range responses, or the data validation feature can be applied.
Analyse the survey data
Response rates are an important indication of the generalisability of results to the entire hospital. Higher response rates increase trust that the results are a representation of staff views. Response rates should be reported alongside any survey data.
Ineligible surveys are those that are:
- Completely blank
- Contain ‘Does not apply/Don’t know’ for all survey items
- Contain the exact same answer to all the items in the survey
- Contain responses to less than 6 of the 26 survey rating items (i.e. surveys less than 20% complete).
These responses should be removed from the analysis.
To calculate the response rate, divide the number of eligible surveys returned by the number of eligible staff who were sent the survey. For example, if there are 500 staff were sent the survey, and you receive 125 responses, your response rate is 25% (125/500).
Dealing with skipped question and 'Does not apply/Don’t know' responses
While the Does not apply/Don’t know response option will limit the amount of missing data, there are still likely to be some instances where respondents answer most questions but skip a question or two. Exclude the Does not apply/Don’t know and missing responses when calculating your responses to the survey items.
Depending on your audience you may wish to display the number or proportion of Does not apply/Don’t know and missing data as additional information under your figures or include this in a separate table at the end of a more detailed report.
Frequencies
One of the simplest ways to analyse the results is to calculate the frequency of responses for each survey item. This means reporting the number or percentage of respondents who selected each response for each survey item.
Percent positive
The most common way to score the A-HSOPS 2.0 is to calculate the percentage of positive scores for each survey item. This provides a single number to interpret for the end user, increasing the way data can be presented. Information on calculating percent positive score for positively and negatively worded items is provided below.
For positively worded items - percent positive scores are the combined percentage of respondents who answered ‘Strongly agree’ or ‘Agree’ or ‘Always’ or ‘Most of the time’.
'My supervisor / manager seriously considers staff suggestions for improving patient safety'
| Response | Number of responses | Response percentage | Combined percentages |
|---|---|---|---|
| 1 = Strong disagree | 10 | 20% | 40% negative |
| 2 = Disagree | 20 | 20% | |
| 3 = Neither agree nor disagree | 10 | 10% | 10% neutral |
| 4 = Agree | 40 | 30% | 50% positive |
| 5 = Strongly agree | 20 | 20% | |
| Total | 100 | 100% | 100% |
| 9 = Does not apply/Don’t know | 10 | - | - |
| Blank = Missing (did not answer | 5 | - | - |
| Total number of responses | 115 | - | - |
For negatively worded items - percent positive scores are the combined percentage of respondents who answered ‘Strongly disagree’ or ‘Disagree’, or ‘Never’ or ‘Rarely’, because a negative answer on a negatively worded item indicates a positive response.
‘My supervisor /manager wants us to work faster during busy times, even if it means taking shortcuts.’
| Original response | Recode | Number of responses | Response percentage | Combined percentages |
|---|---|---|---|---|
| 1 = Strong disagree | 5 | 10 | 10% | 20% positive |
| 2 = Disagree | 4 | 10 | 10% | |
| 3 = Neither agree nor disagree | 3 | 10 | 10% | 10% neutral |
| 4 = Agree | 2 | 40 | 40% | 70% negative |
| 5 = Strongly agree | 1 | 30 | 30% | |
| Total | 100 | 100% | 100% | |
| 9 = Does not apply/Don’t know | 10 | - | - | |
| Blank = Missing (did not answer | 10 | - | - | |
| Total number of responses | 120 | - | - |
The A-HSOPS 2.0 has nine composites (each composed of 2-3 items which measure the same underlying concept). Calculating composite scores is a simple way of providing a high level overview of the survey findings. The composites and their items are provided in the technical specifications.
Step 1: Make sure all negatively worded items have been recoded correctly
Step 2: Calculate the composite percent positive/composite score for each individual response
Step 3: Average the composite percent positive/composite score by the number of responses included in the analysis.
Example calculation of composite scores for the teamwork composite
|
Composite |
Item wording |
Person 1 |
Person 2 |
Person 3 |
|---|---|---|---|---|
|
Step 1: Recode |
In this unit, we work together as an effective team |
Agree (4) |
Neither agree nor disagree (3) |
Agree (4) |
|
During busy times, staff in this unit help each other |
Strongly agree (5) |
Agree (4) |
Agree (4) |
|
|
There is a problem with disrespectful behaviour between staff working in this unit (negatively worded) |
Strongly disagree(5) |
Agree (2) |
Agree (4) |
|
|
Step 2: Calculate for each person |
Individual composite score |
(4+5+5)/3= 4.67 |
(3+4+2)/3= 3.00 |
(4+4+4)/3= 4.00 |
|
Individual composite percent positive |
3 out of 3 are positive (3/3)*100= 100.00% |
1 out of 3 positive (1/3)*100= 33.33% |
3 out of 3 positive (3/3)*100= 100.00% |
|
|
Step 3: Average |
Unit level composite score |
(4.667+3.000+4.000)/3= 3.89 |
||
|
Unit level composite percent positive |
(100.00+33.33+100.00)/3= 77.77% |
Note this example uses a unit made up of three people for simplicity. Real responses should not be reported for groups less than five.
An overall safety culture score and overall percent positive score can also be calculated. To calculate the overall safety culture score/ overall percent positive:
Step 1: Calculate an average score or percent positive for each respondent
Step 2: Calculate an average for the hospital – sum all responses and divide by the number of respondents.
Another way you can analyse the data is by segmenting the results by demographics or work characteristics. For example, examining differences in patient safety culture between clinical and non-clinical staff or investigating differences in patient safety culture depending on years of service at a given hospital.
While descriptive statistics are often sufficient to feed back information to begin a dialogue about quality improvement, inferential statistics can be useful for more detailed analysis.
Inferential statistics are particularly useful for testing hypotheses, such as evaluating a safety initiative your organisation has undertaken. Inferential statistics can be used to track hospital results over time to see if changes are significant. You may also want to make inferences about different units/departments within your hospital or examine the results between a number of hospitals to drive improvement.
For analysis using inferential statistics, you may need to consider seeking external support – unless there is someone at your hospital who is experienced in this area.
Inferential statistics include:
- T-tests: Determines if there is a significant difference between the means of two groups
- Analysis of Variance (ANOVA): Used to determine whether there are statistically significant differences between the means of two or more independent groups
- Analysis of Covariance (ANCOVA): Similar to the ANOVA, the ANCOVA determines differences between groups while statically controlling for other variables
- Regression analysis: A suite of statistical procedures for examining the relationship between two or more variables of interest.
Open-ended responses provide depth and detail to complement the quantitative survey data – they help to understand the 'why' and 'how' of the rating questions. They can also provide information on topics not covered in the survey and suggestions on new ideas for improvement.
Turning comments into useful information can be resource intensive and it is important to allow time and resources to do this in your analysis plan.
De-identifying responses
Before open ended responses are examined, they should be carefully de-identified to ensure that they do not contain any information that can be used to identify the respondent or individuals referred to in the comments. This includes removing names but also identifying characteristics included in the comments, such as personal characteristics.
Providing direct quotes can be useful, particularly for senior management to get a broad perspective on the culture of their organisation. However, the Commission recommends caution in providing quotes to direct supervisors and managers as these quotes may be identifiable by writing style or content.
Coding and analysis
Open ended responses can be examined using qualitative analysis. Qualitative analysis involves reviewing the data multiple times and coding the themes that emerge. The Commission recommends a three-step process for analysing open ended responses from the A-HSOPS 2.0.
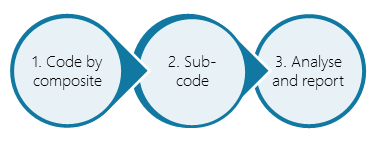
You can code the data in Microsoft Excel or use a specific qualitative data analysis software such as NVivo. Qualitative data analysis software is not essential and many people prefer coding using more manual processes such as pen and paper or an Excel spreadsheet.
Demographic information
Consider which demographic information you want to use in the analysis of the comments before you start coding – such as unit/work area, position or length of service.
You can either keep the demographic information alongside the comments while you code or split the comments up by that demographic before you start coding.
Code by composite
For the first stage of coding, use the survey composites as themes. One or two staff members read through the comments and assign the composites. Some comments may fit under multiple composites. For example, the example comment below can fit under both ‘teamwork’ and ‘communication openness’ composites. In this case, code the comment to each of the composites that it aligns with.
‘I like that at every morning huddle, our PCD [patient care director] asks for any safety stories to share with the team…. Sometimes they are good catches and sometimes they are mistakes, but we feel comfortable sharing and learning how to be better.’
This is known as deductive coding; a top-down approach to coding qualitative data using an existing set of themes (in this case, the nine composite measures of safety culture). Coding by composite will allow these data to be interrogated alongside the quantitative data collected in the survey.
Sub-code
Once you have all the comments grouped together under each composite, read through the comments in each composite individually. Identify recurring themes and assign descriptive codes to each of the sub-themes. You may need to revise these codes as you go by reading over the comments and sub-themes to ensure they fit well.
Analyse and report
Tallying the number of comments per theme is a useful way to identify the most prominent themes. Use illustrative quotes to demonstrate each of the themes (and sub-themes). If you analyse the comments by demographics (e.g., position or length of service), you may wish to include that information alongside the comments (so long as the staff members remain non-identifiable). A good rule of thumb to maintain confidentiality is to only report one demographic per quote.
See below for an example of comments coded into the composite ‘Hospital Management Support for Patient Safety’, as well as three identified sub-themes.
Theme: Hospital management support for patient safety
|
Sub-theme |
Example quote |
|---|---|
|
A desire for hospital management to better understand staff difficulties and patient safety concerns n=5 |
|
|
Budgetary concerns drive resource scarcity n=7 |
|
|
Frustration about openness to staff input or timely follow-through from management regarding staff concerns n=12 |
|
There are a range of ways the data can be presented. Irrespective of the format used, a concise summary which is easy to understand without creating cognitive load is absolutely critical for all staff to engage in results and build trust in the process.
Different audiences will have different requirement, interest and time – a number of different reports may be required to reach all stakeholders.
A number of options for data presentation are provided below.
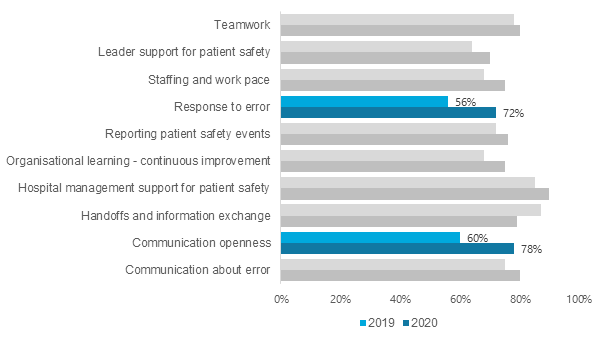
Clustered bar chart (Composites)
This example shows percentage positive results for each composite at two time points. Colour can be useful in highlighting where the results show significant improvements.
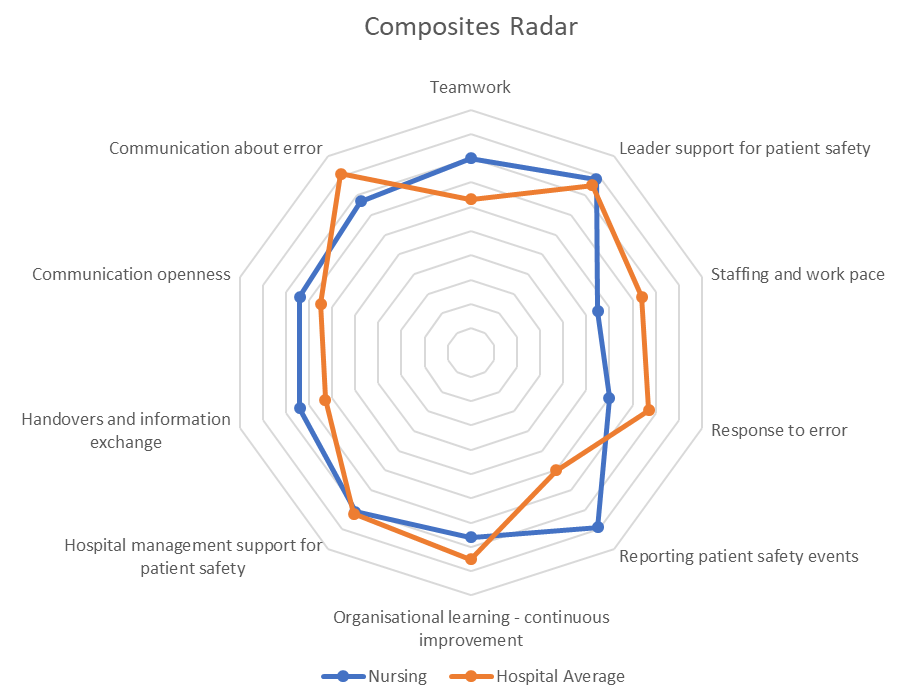
Radar chart (composite level)
Radar charts can be useful to convey all of the composites on one page. Including a comparison with the hospital average or previous score and help with the interpretation of the data.
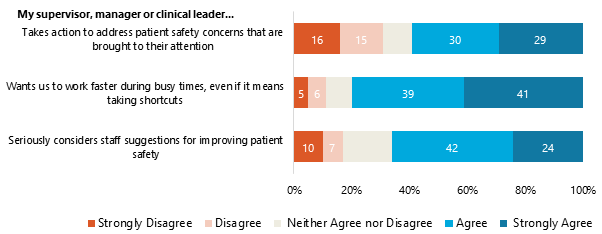
Stacked bar chart (Item-level)
This example shows percentages of agreement for each item within one composite: Supervisor, Manager or Clinical Leader Support for Patient Safety.
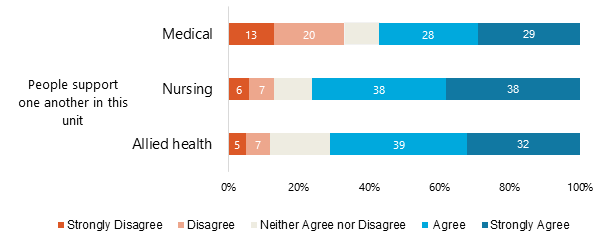
The next example shows percentage of agreement separately for health workers for one item. In this case, the results indicate that medical staff disagreed with this item more than other staff, and may be an area for further investigation.
Highs to lows
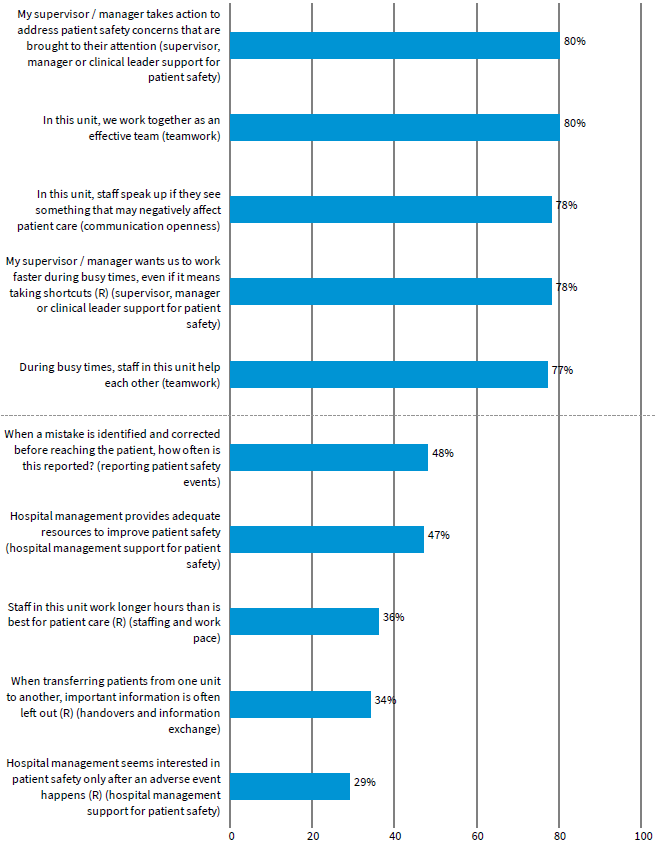
A simple analysis you can use is to report the percent positives for each survey item and use this to create a list of the five highest and five lowest survey items.
